Analysis Tools
Crop Global Performance Predictor
The CropGPP enables the indirect prediction of mean breeding values (additive effect + environment mean) in specific environments for newly genotyped test individuals based only in genotype. The additive effects are obtained by the matrix of the frequency of the alternative allele for the test individuals for particular loci by the matrix of effect of the alternative allele in specific environments for the particular loci. Below are currently available models:
Model for sweetness in peach
Descriptive Statistics
Viewing statistics within a category
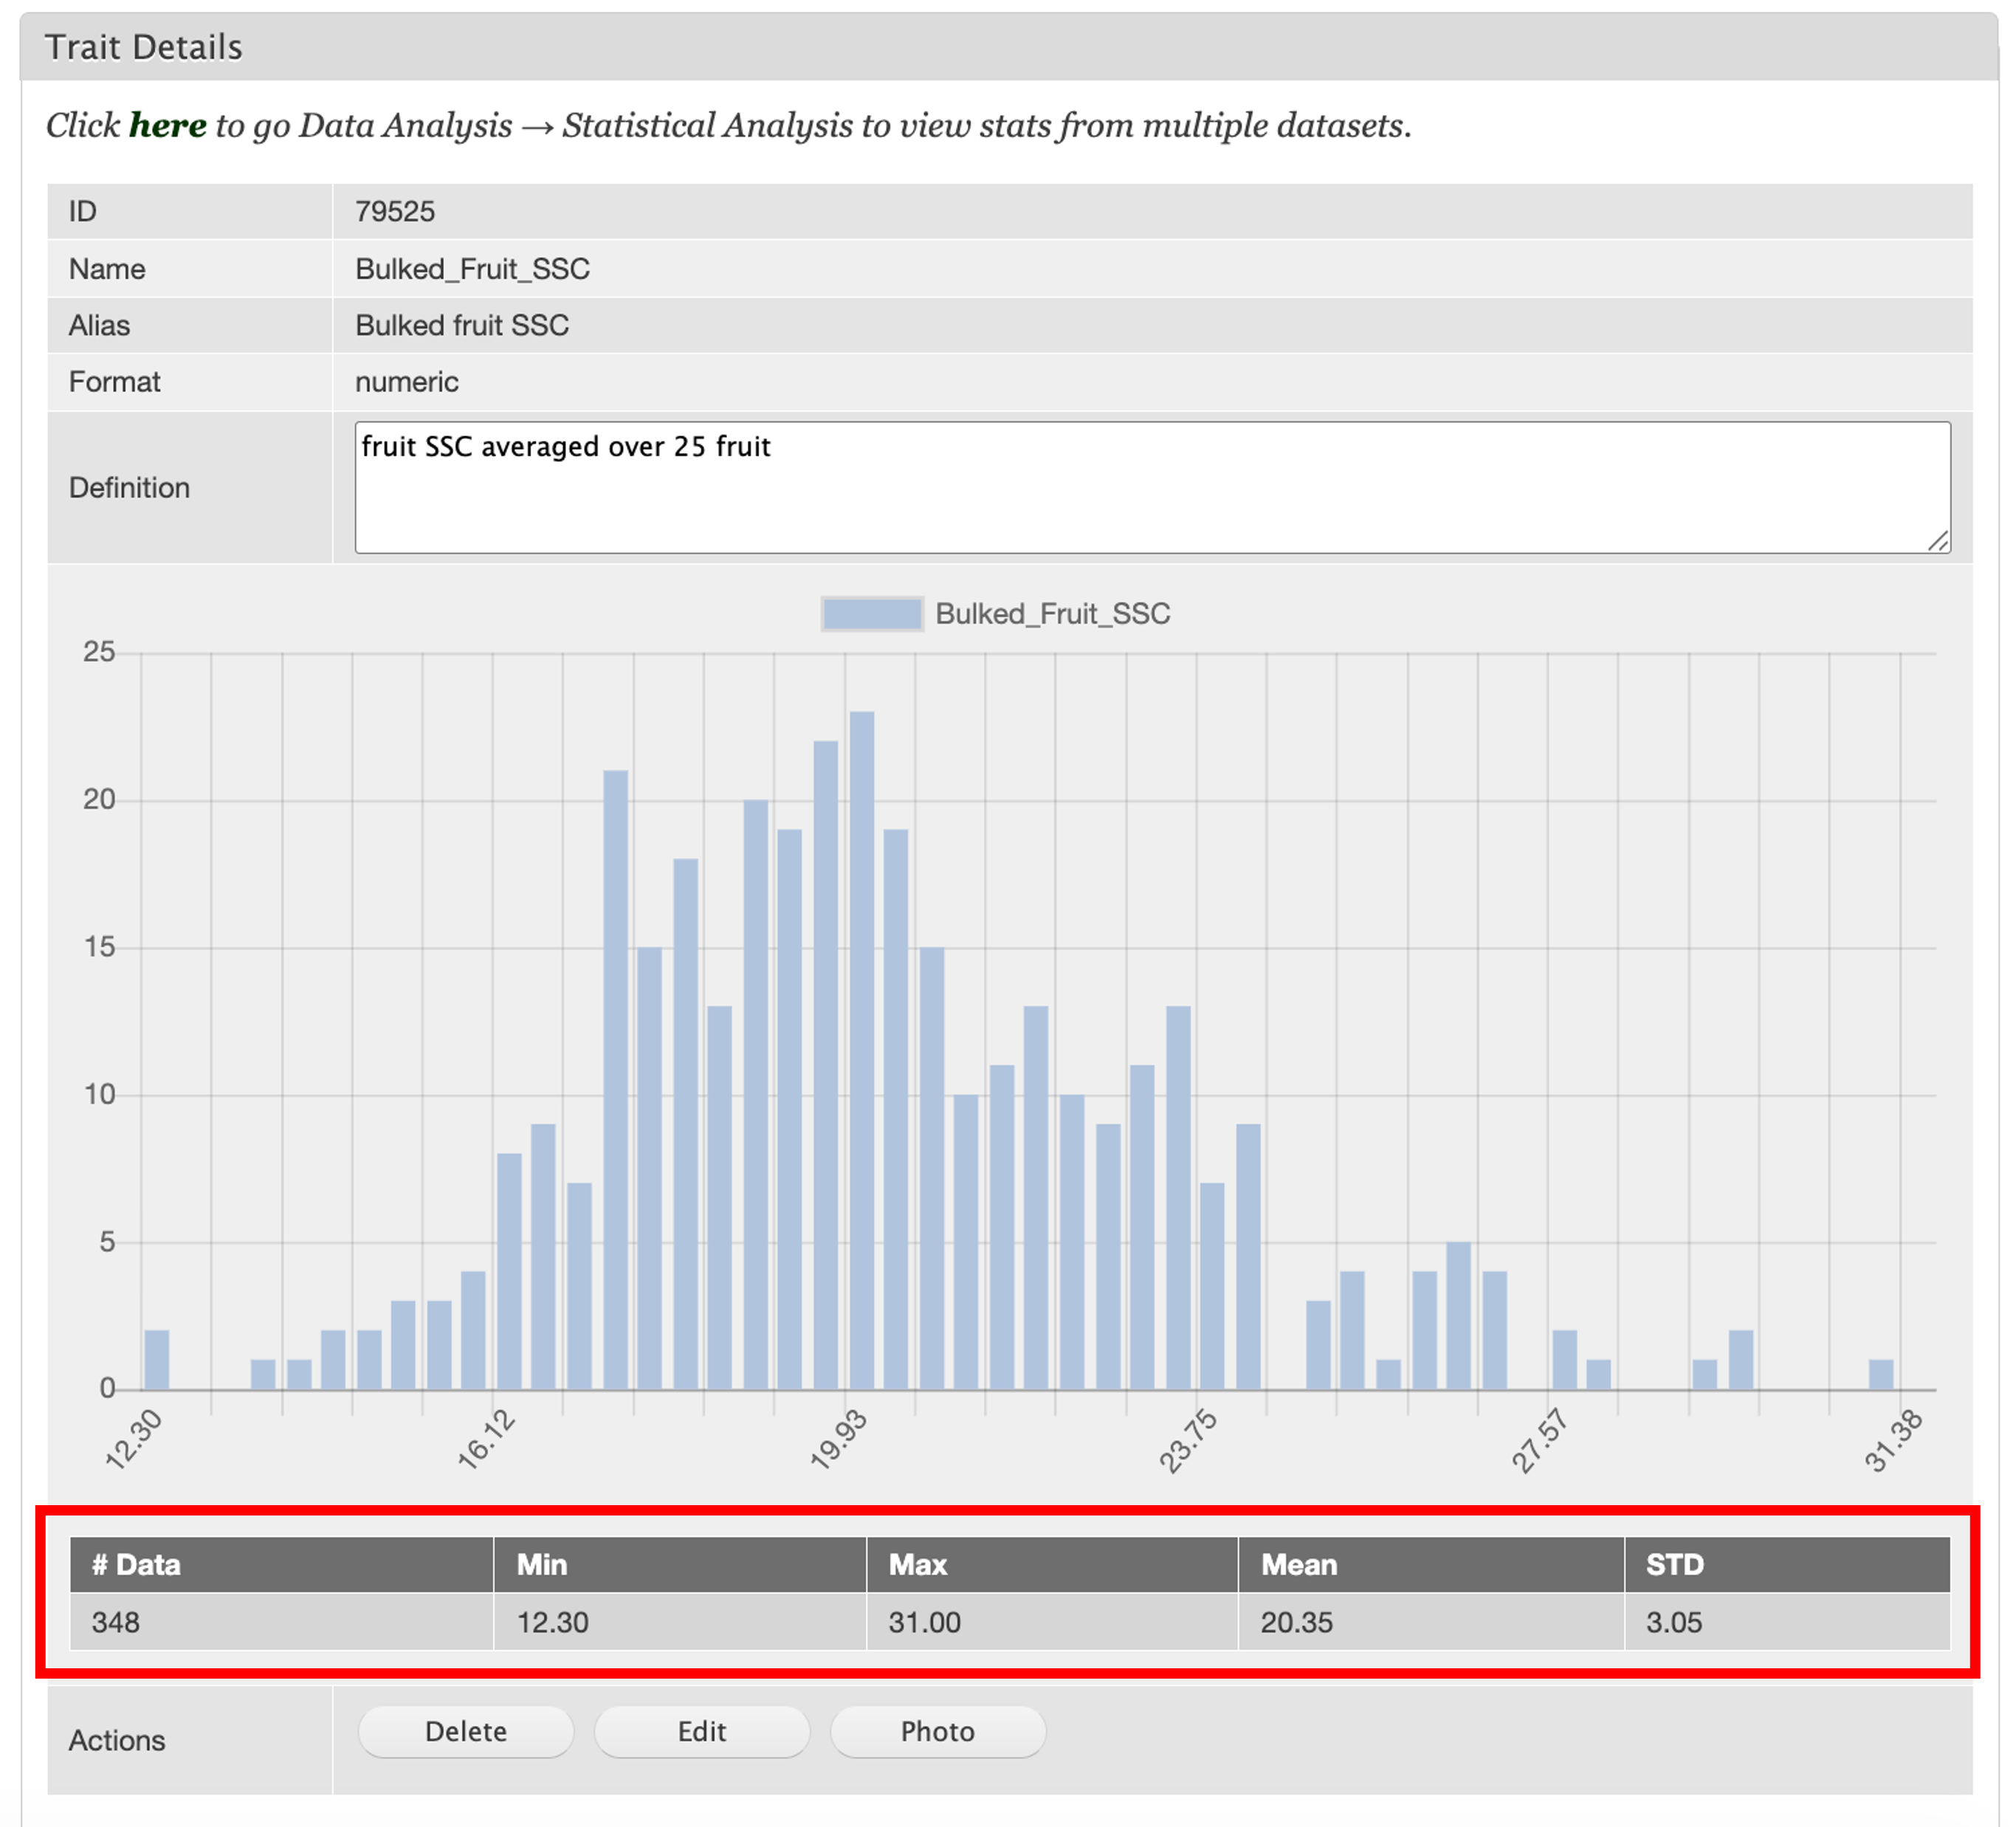
Descriptive statistics for traits can be viewed under various sections under the “Manage Breeding” tab in the accordion menu. For each trait, these statistics will list the number of data points, the maximum, the minimum, the mean, and the standard deviation as well as a histogram of the data. Not only can these be accessed by navigating to the “Trait” tab and selecting the trait you would like to view, they can also be viewed by Location, Cross, Accession, Trial, and Property.
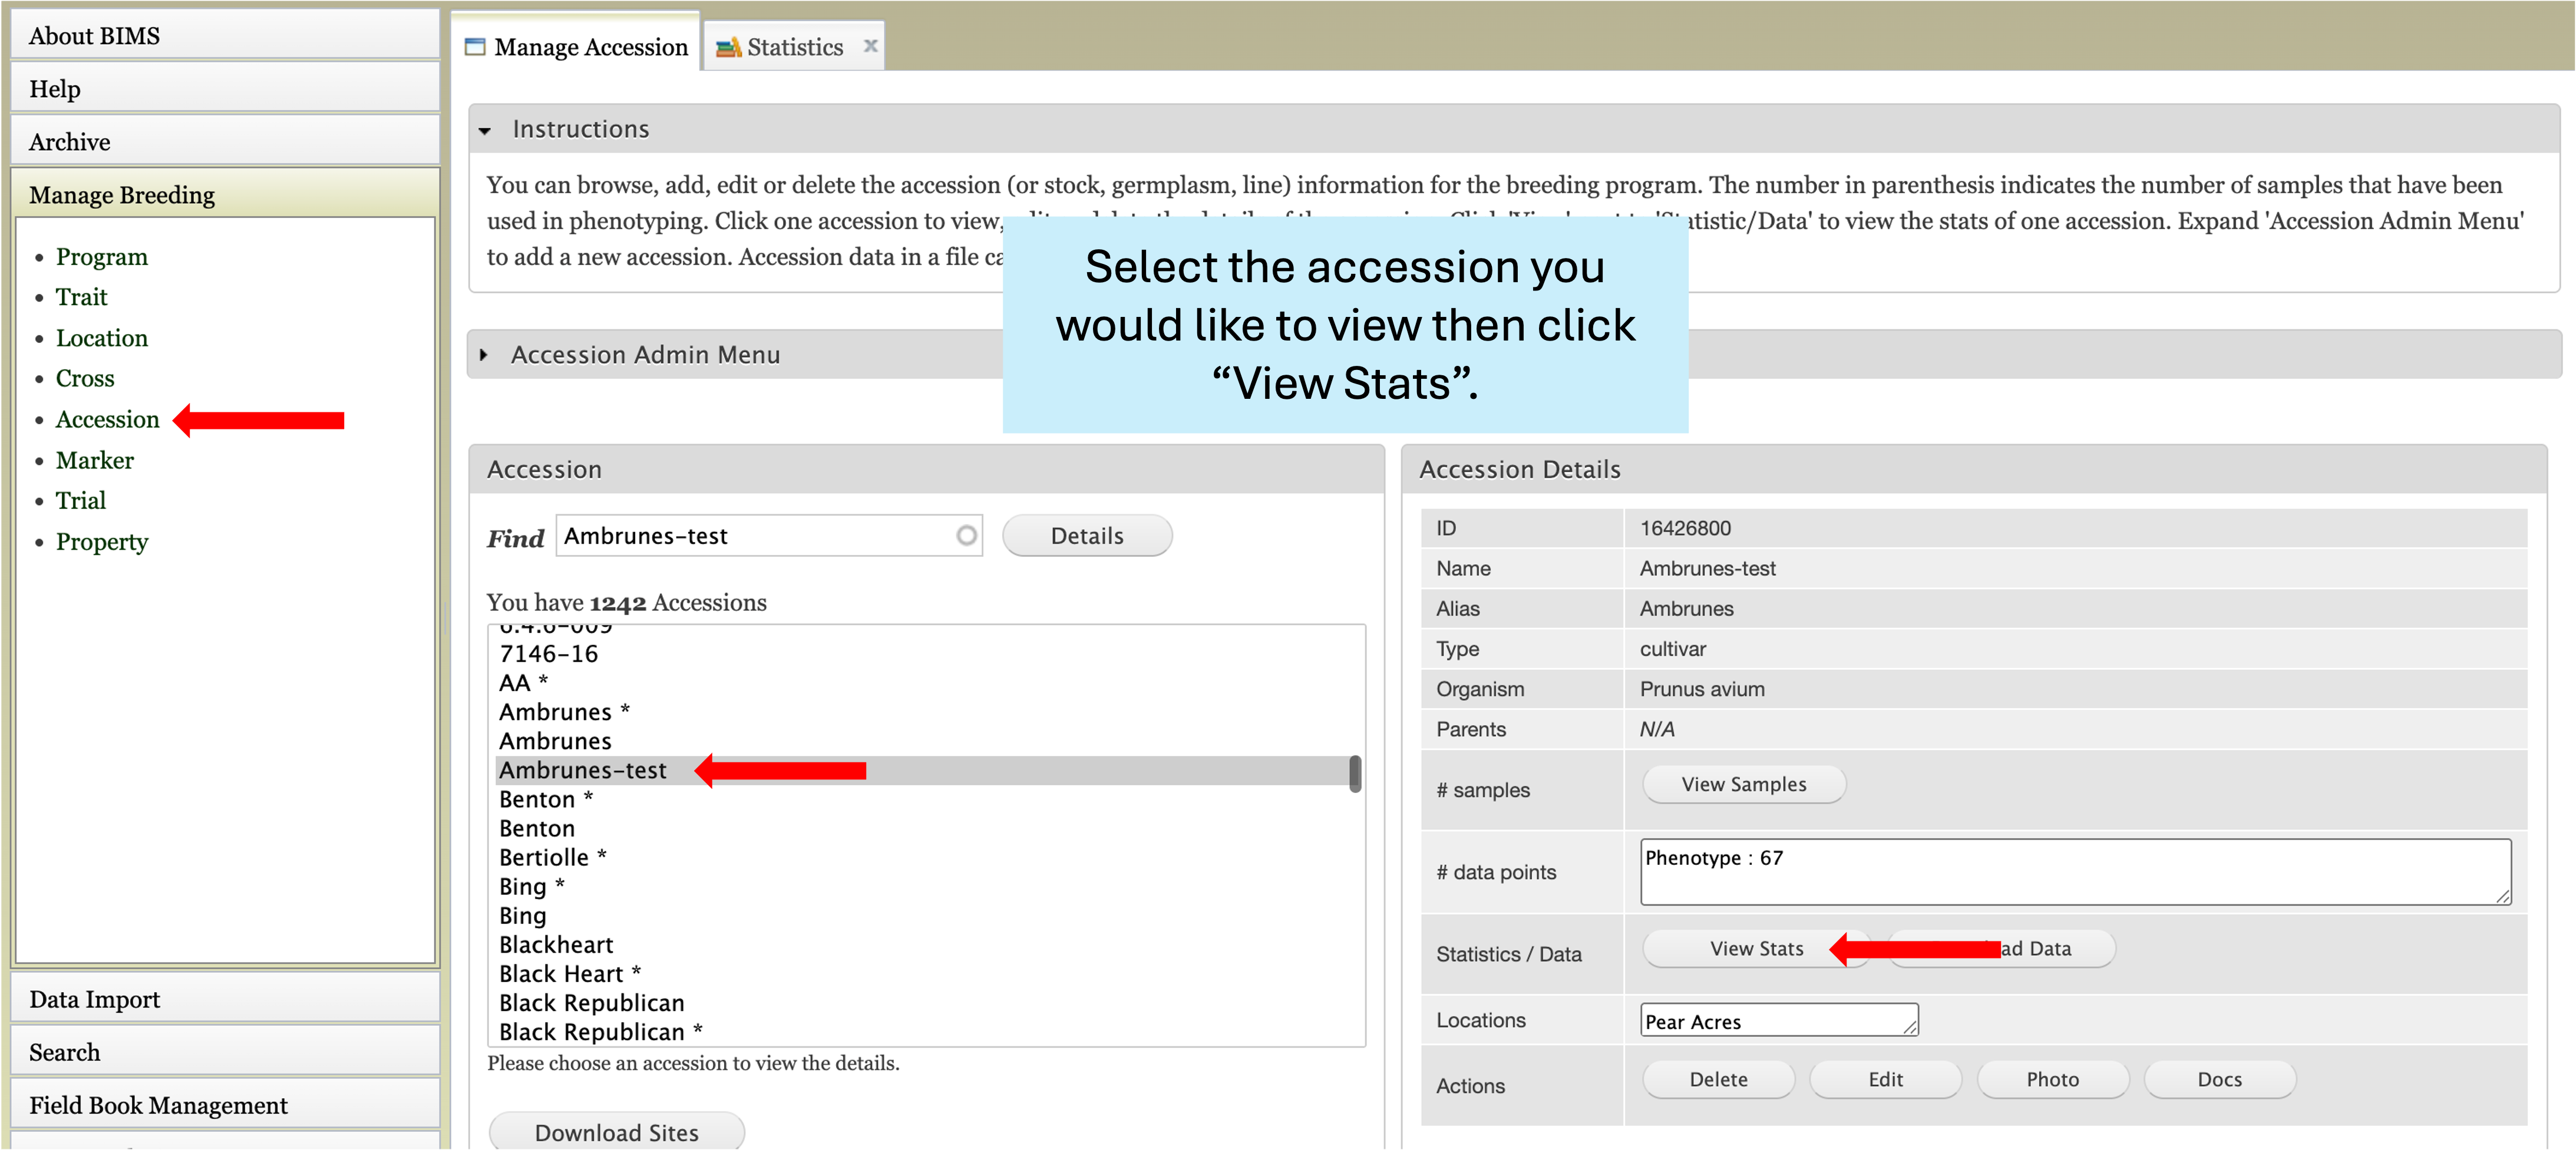
Here, we will show an example of using the “Accession” section to view trait statistics within a certain accession. First, select the “Manage Breeding” tab from the accordion menu and “Accession” from the bulleted list. This will open the “Manage Accession” pop-up tab and a list of all the accessions in your program will appear under “Accession”. Select the accession you would like to view from the list. This will autofill the “Accession Details” box on the right side of the page with details about this accession. To view descriptive statistics, select the “View Stats” button on the Statistics / Data row of the box.
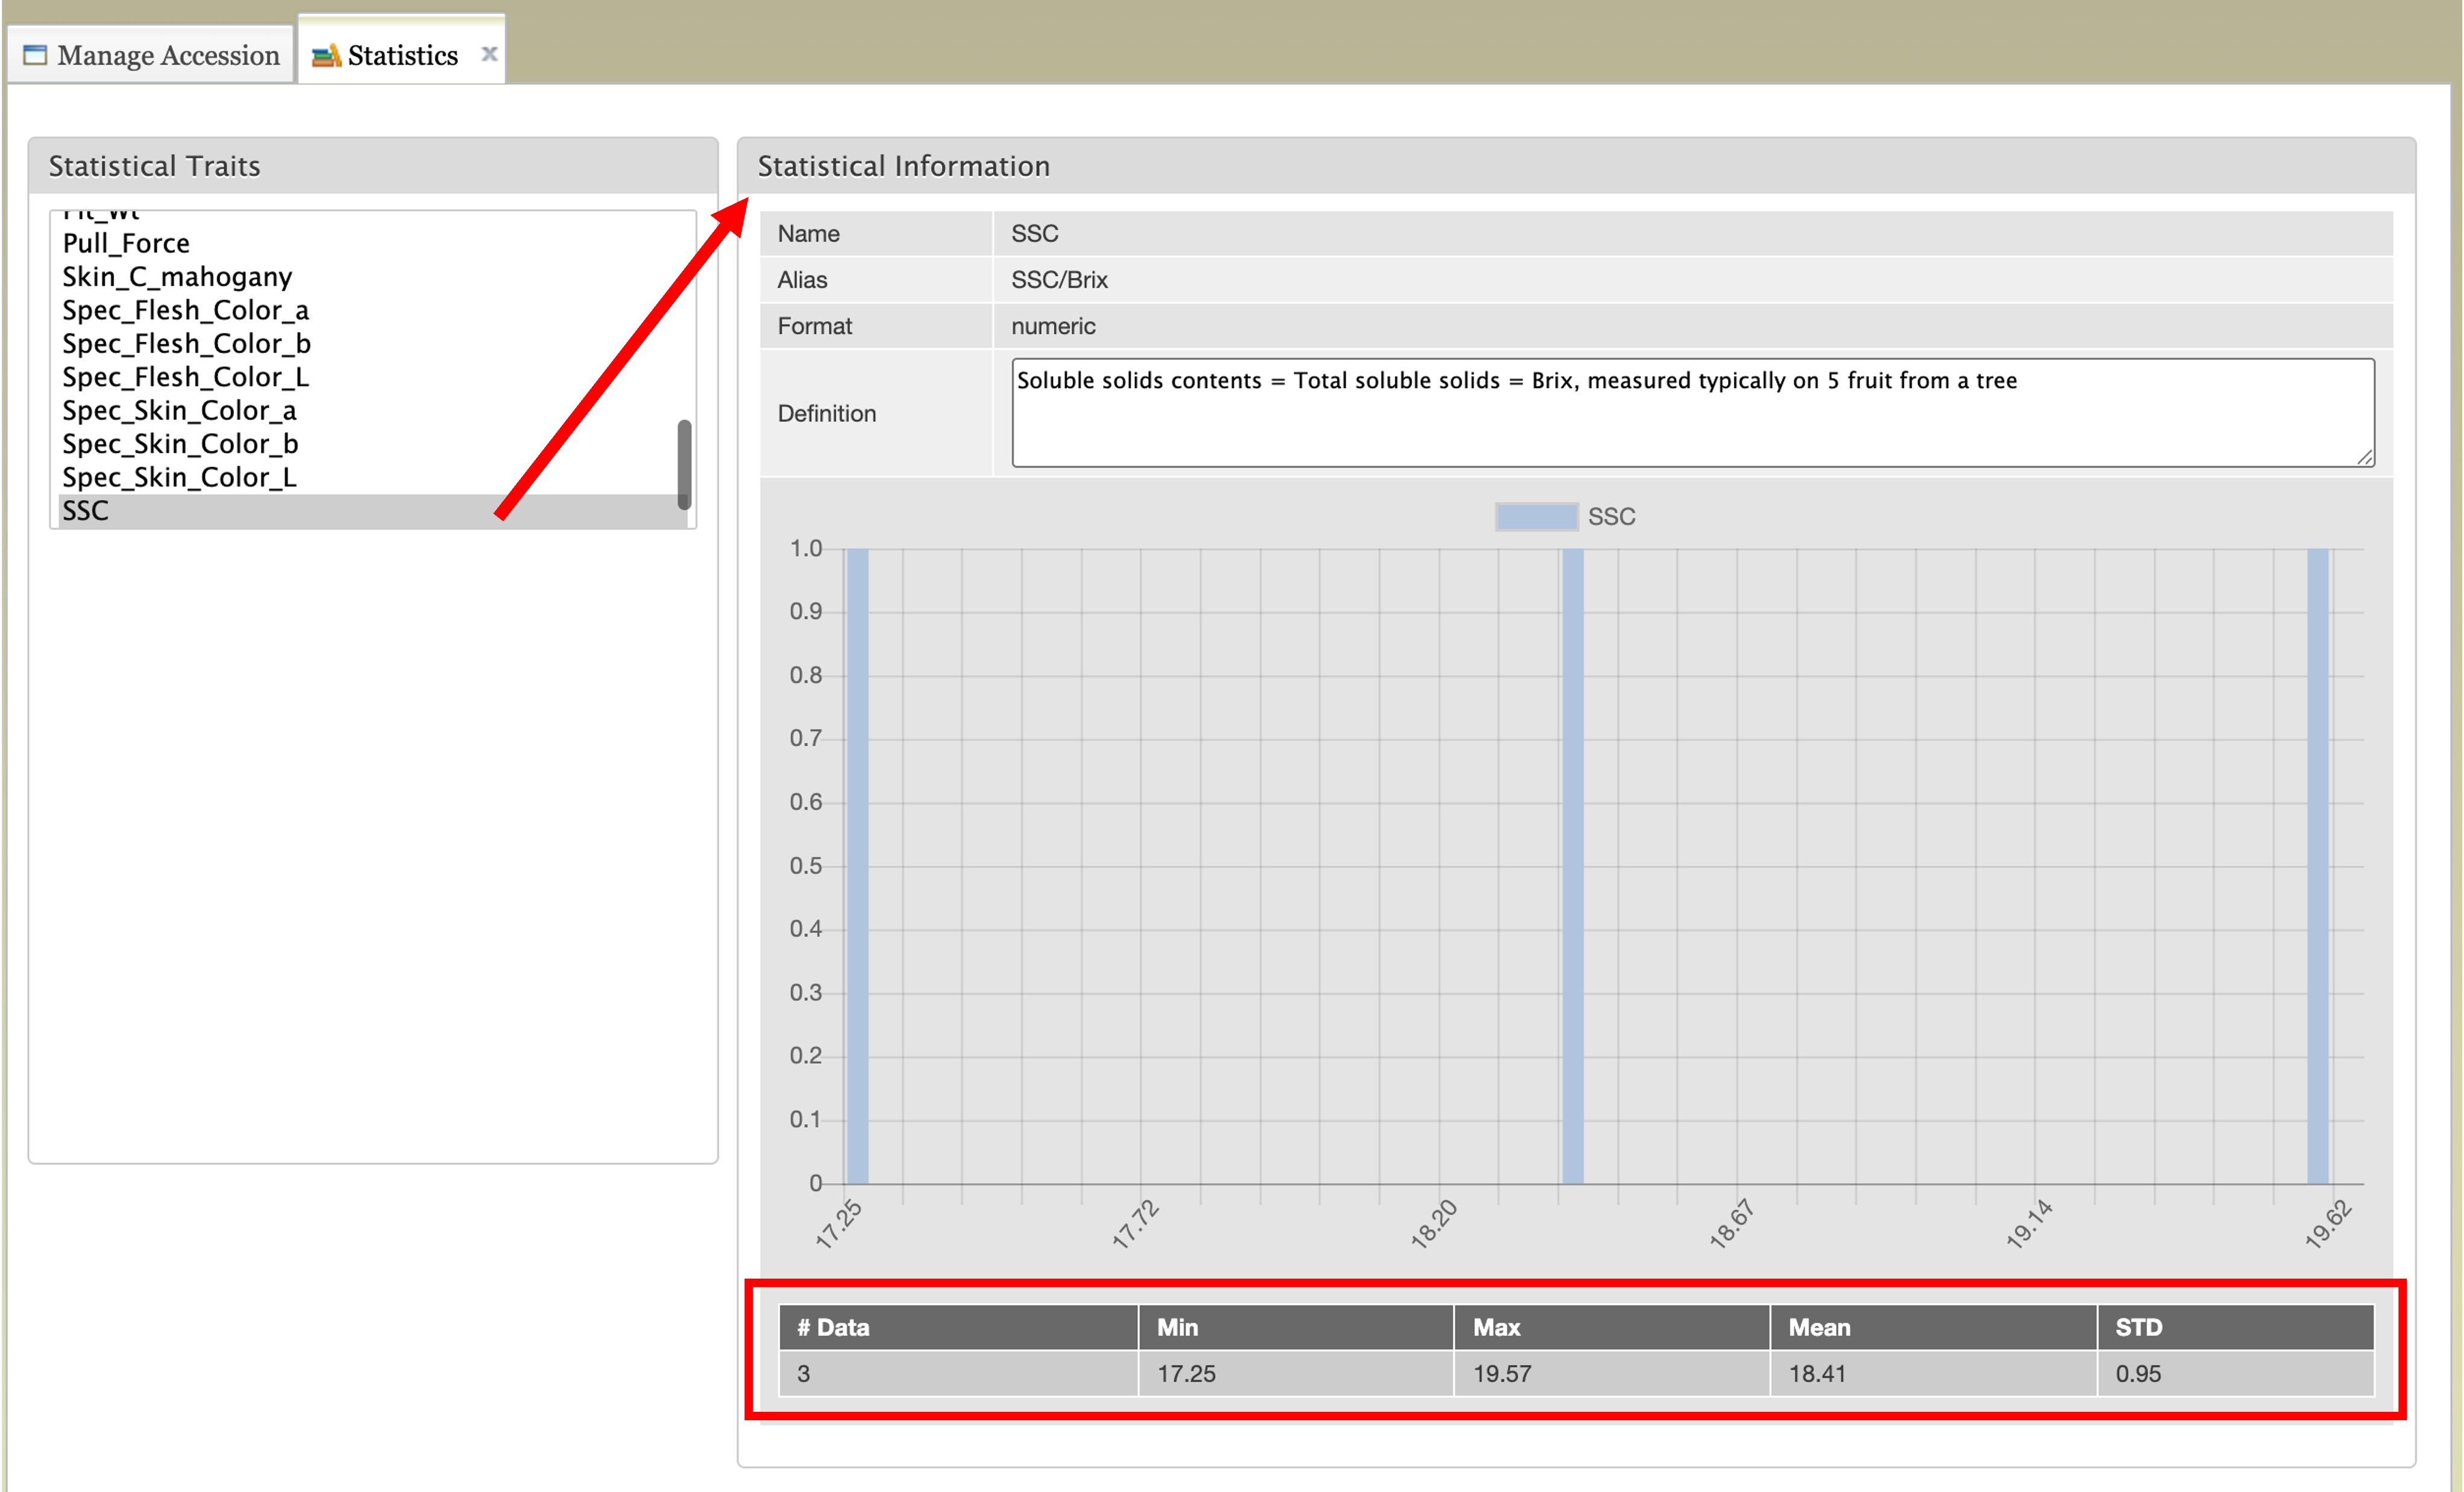
This will open the “Statistics” tab with a list of all traits associated with this accession listed under “Statistical traits”. Selecting a trait from the list will autofill the “Statistical Information” box on the right side of the page. Now, the number of data points, the maximum, the minimum, the mean, the standard deviation, and a histogram of the data will pop-up for the subset of trait data that aligns with your chosen accession. A similar pathway can be followed for the other sections under “Manage Breeding”. More information can be found in the Viewing Data section of the manual.
Viewing and downloading statistics with filters
Within the “Search” tab of the accordion menu, users can filter data and view traits. Properties can be set as filters before selecting traits to view. This allows users to see a histogram of data points within the filter as well as the number of data points, minimum, maximum, mean, and standard deviation. Users can also set a minimum and maximum for data points and add to the filter.
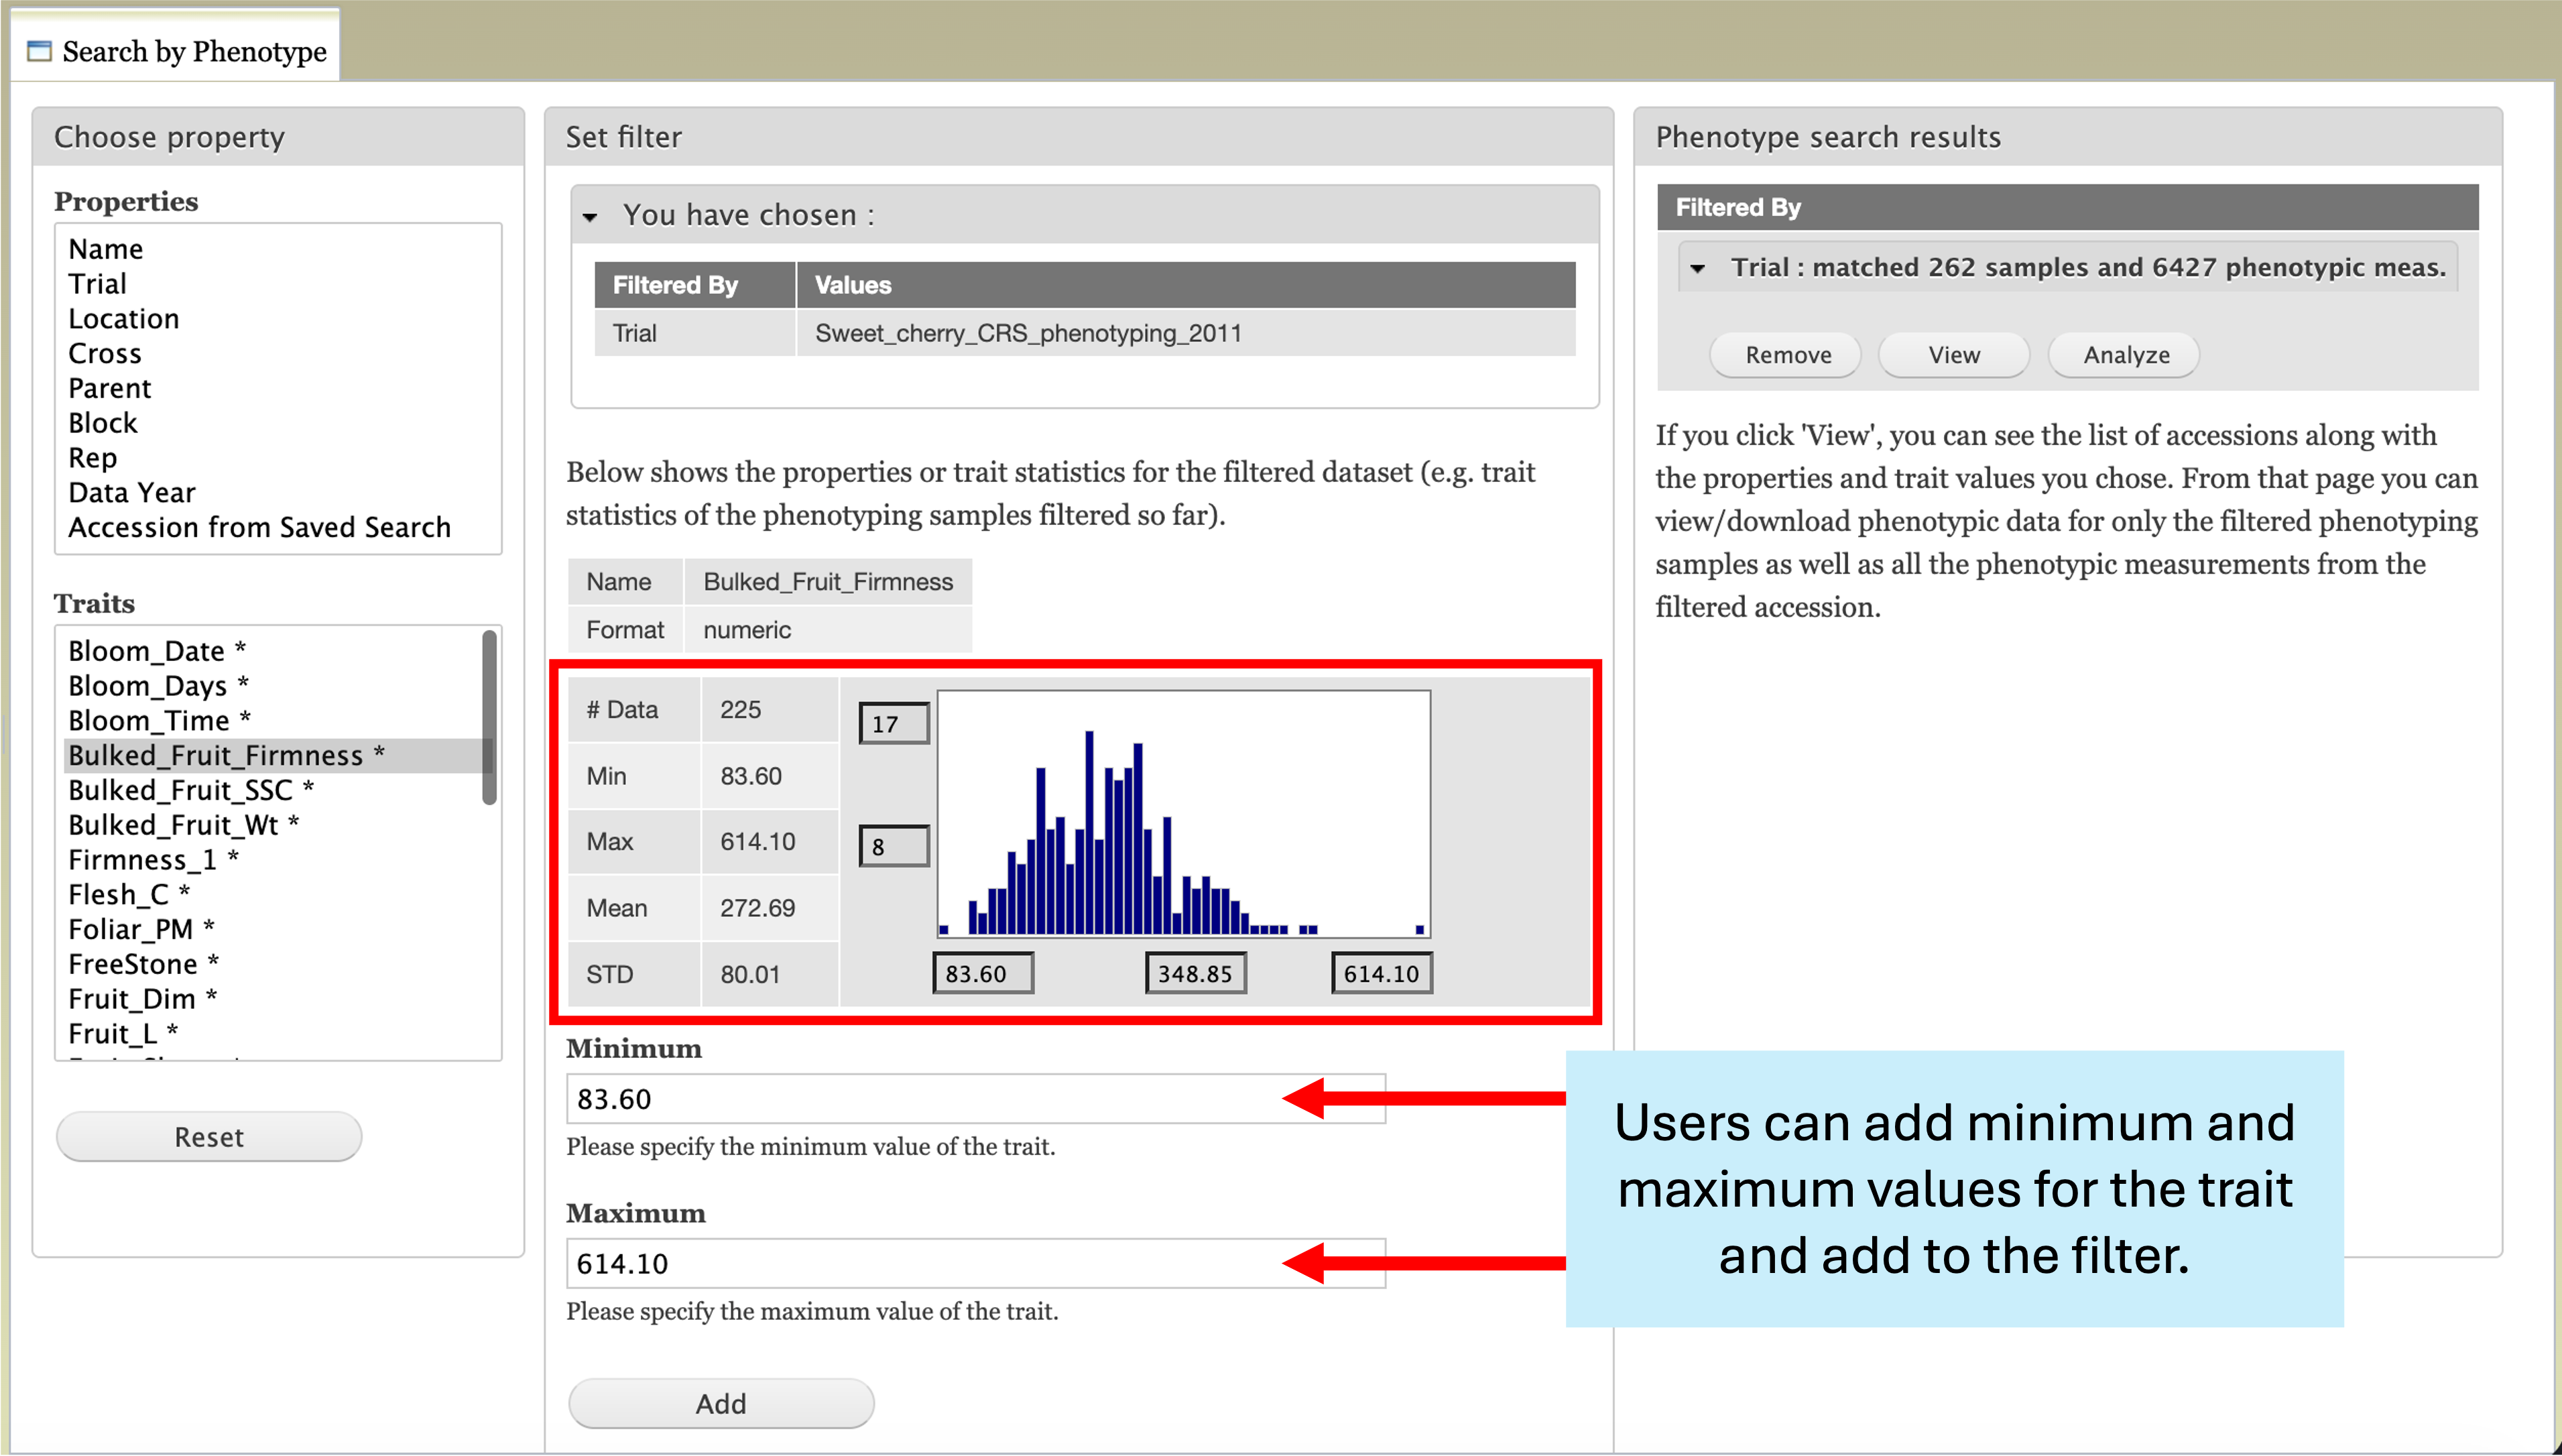
After selecting the desired filters, users can download statistics by selecting the “View” button under the “Phenotype Search Results” box. This will open the “Phenotype Search Results” tab which contains a “Download Data” box. By selecting the check box next to “Statistics” in this section and clicking “Download”, users can download the associated data for the filtered search along with the number of data points, maximum, minimum, mean, standard deviation, and frequency for each trait column downloaded. Additionally, if the checkbox next to “Include averages” is selected, two extra tabs will be added to the downloadable spreadsheet which include the averages for each trait by accession of just the selected samples and of all samples. More information and examples can be found within the Searching Data section.
Comparative analysis
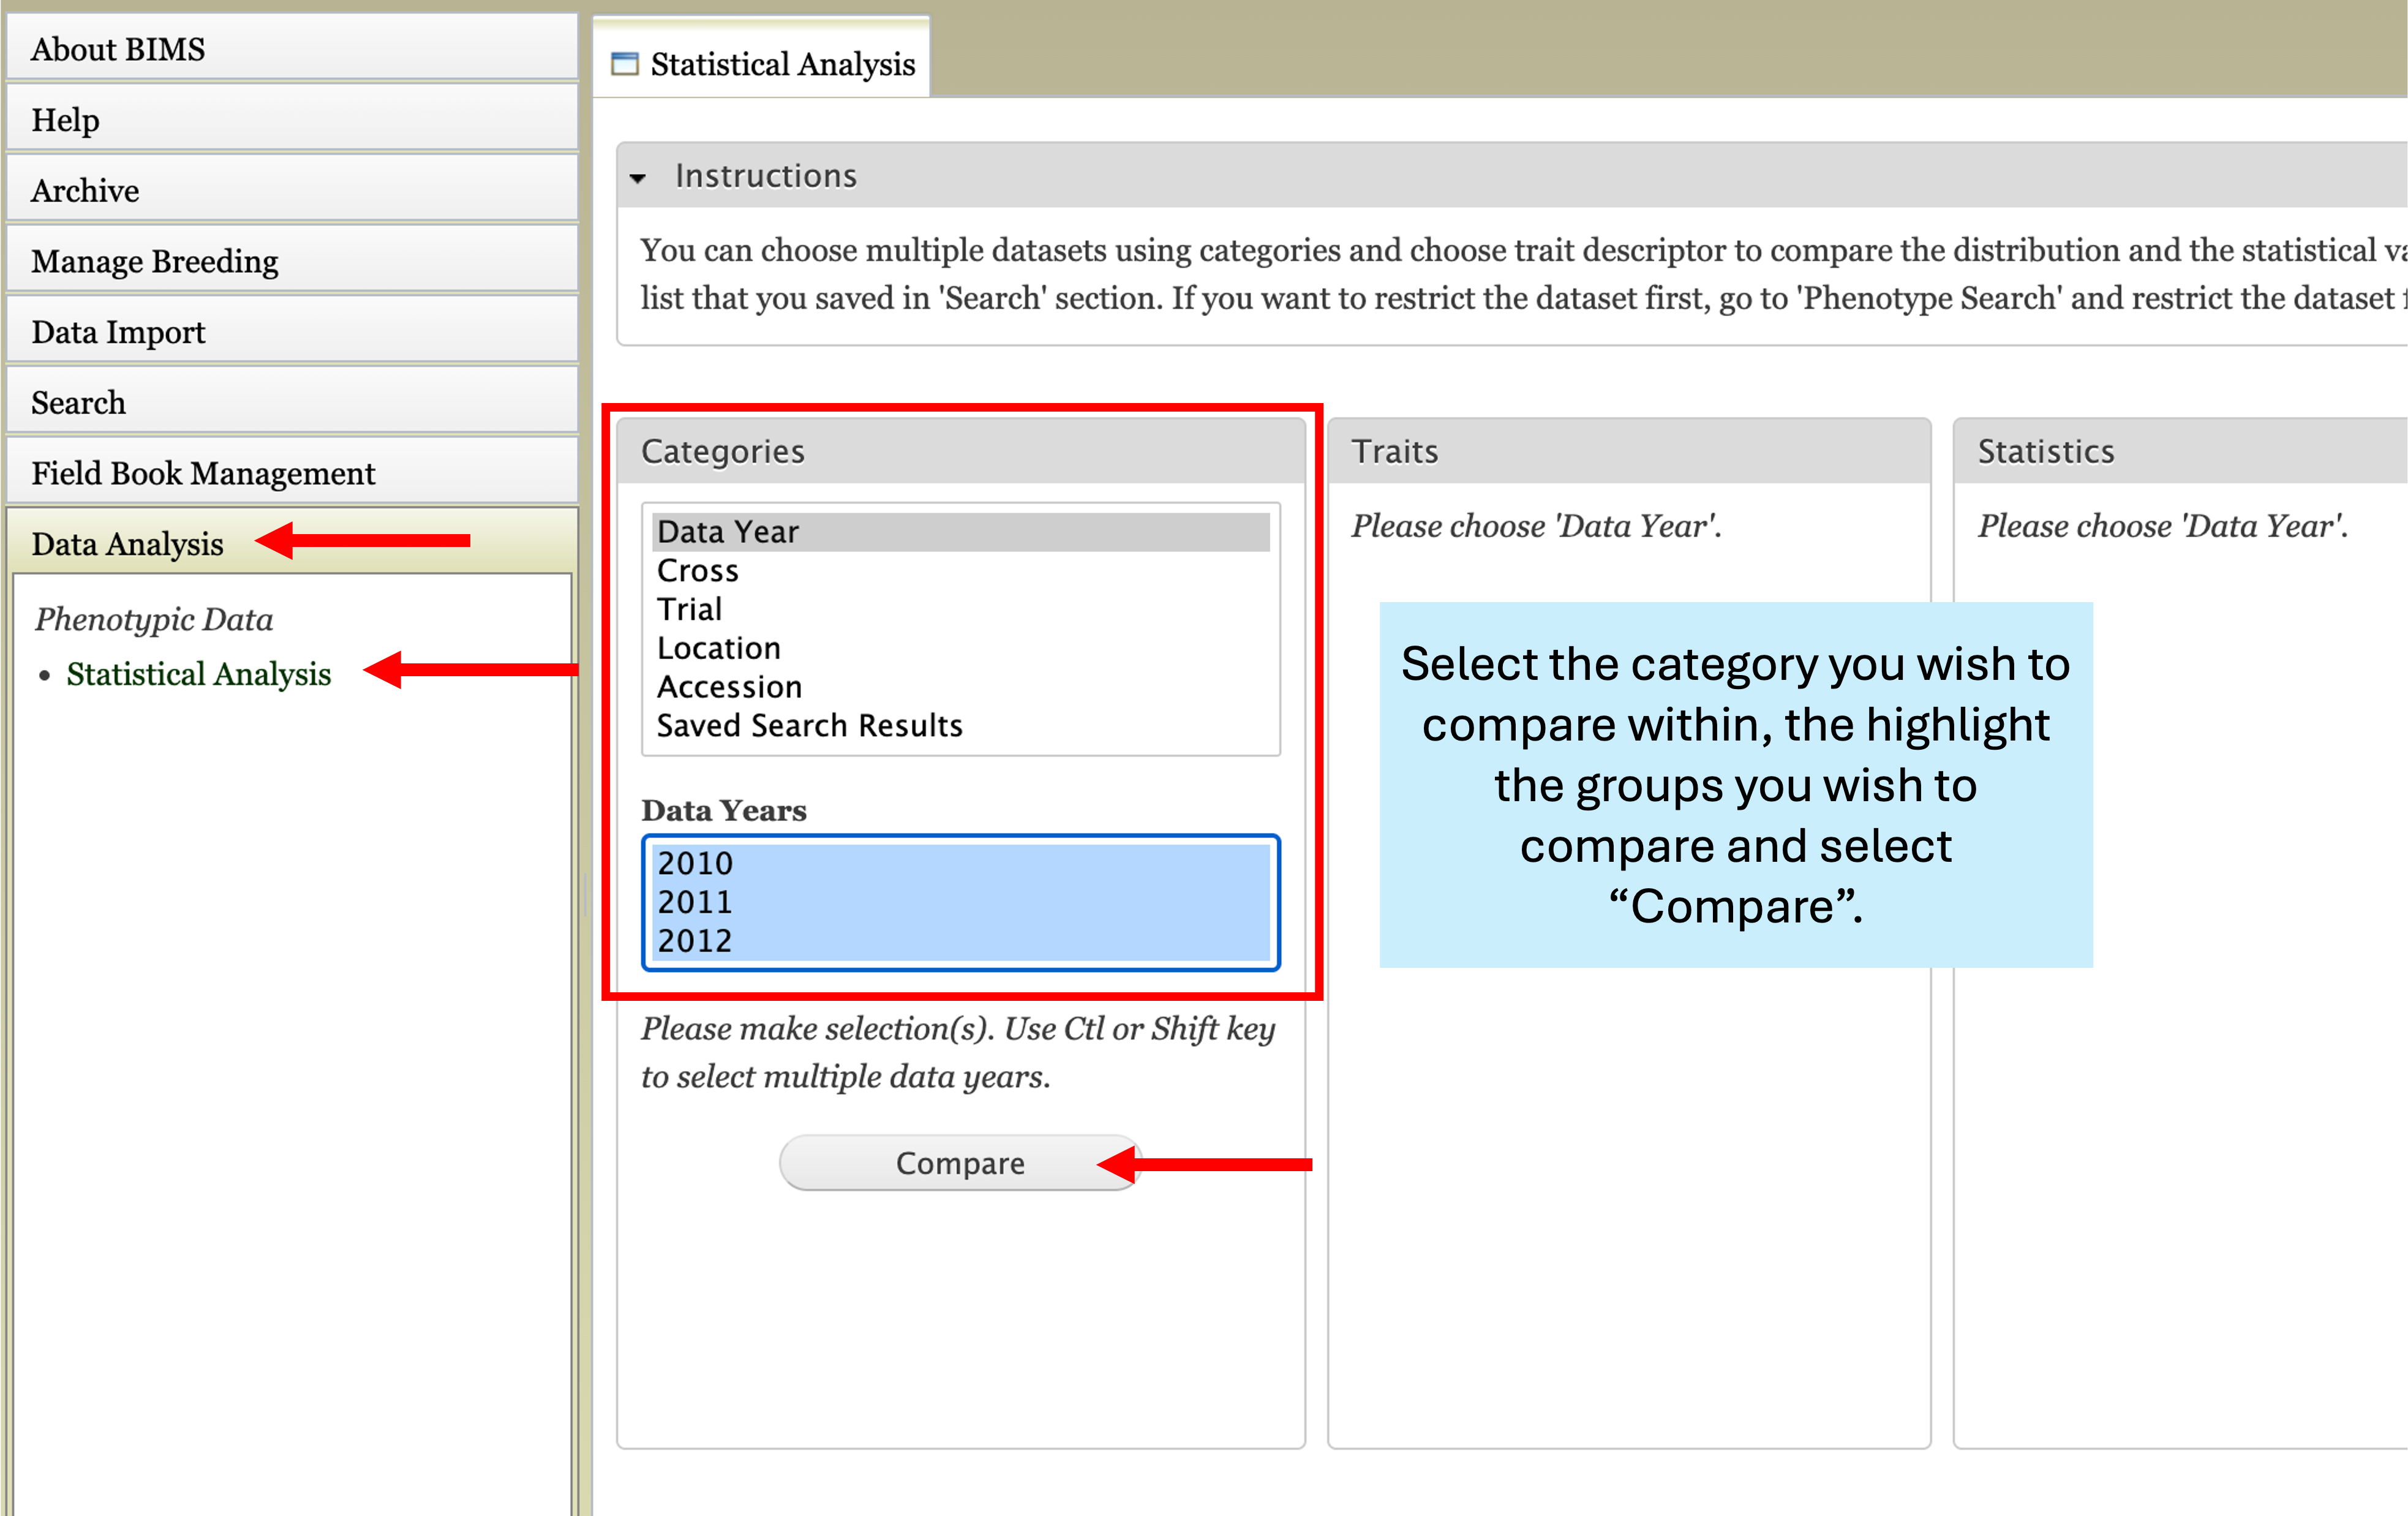
Data can be compared between years, crosses, trials, locations, accessions, and using saved search results. To do so, navigate to the “Data Analysis” tab of the accordion menu and select “Statistical Analysis”. In the “Categories” box, select the category you wish to compare traits within. For this example, we will use “Data Year”. Below, a box will pop-up with the subcategories of your selection. In this instance, it fills with the available years of data. Select the years you wish to compare and click “Compare”.
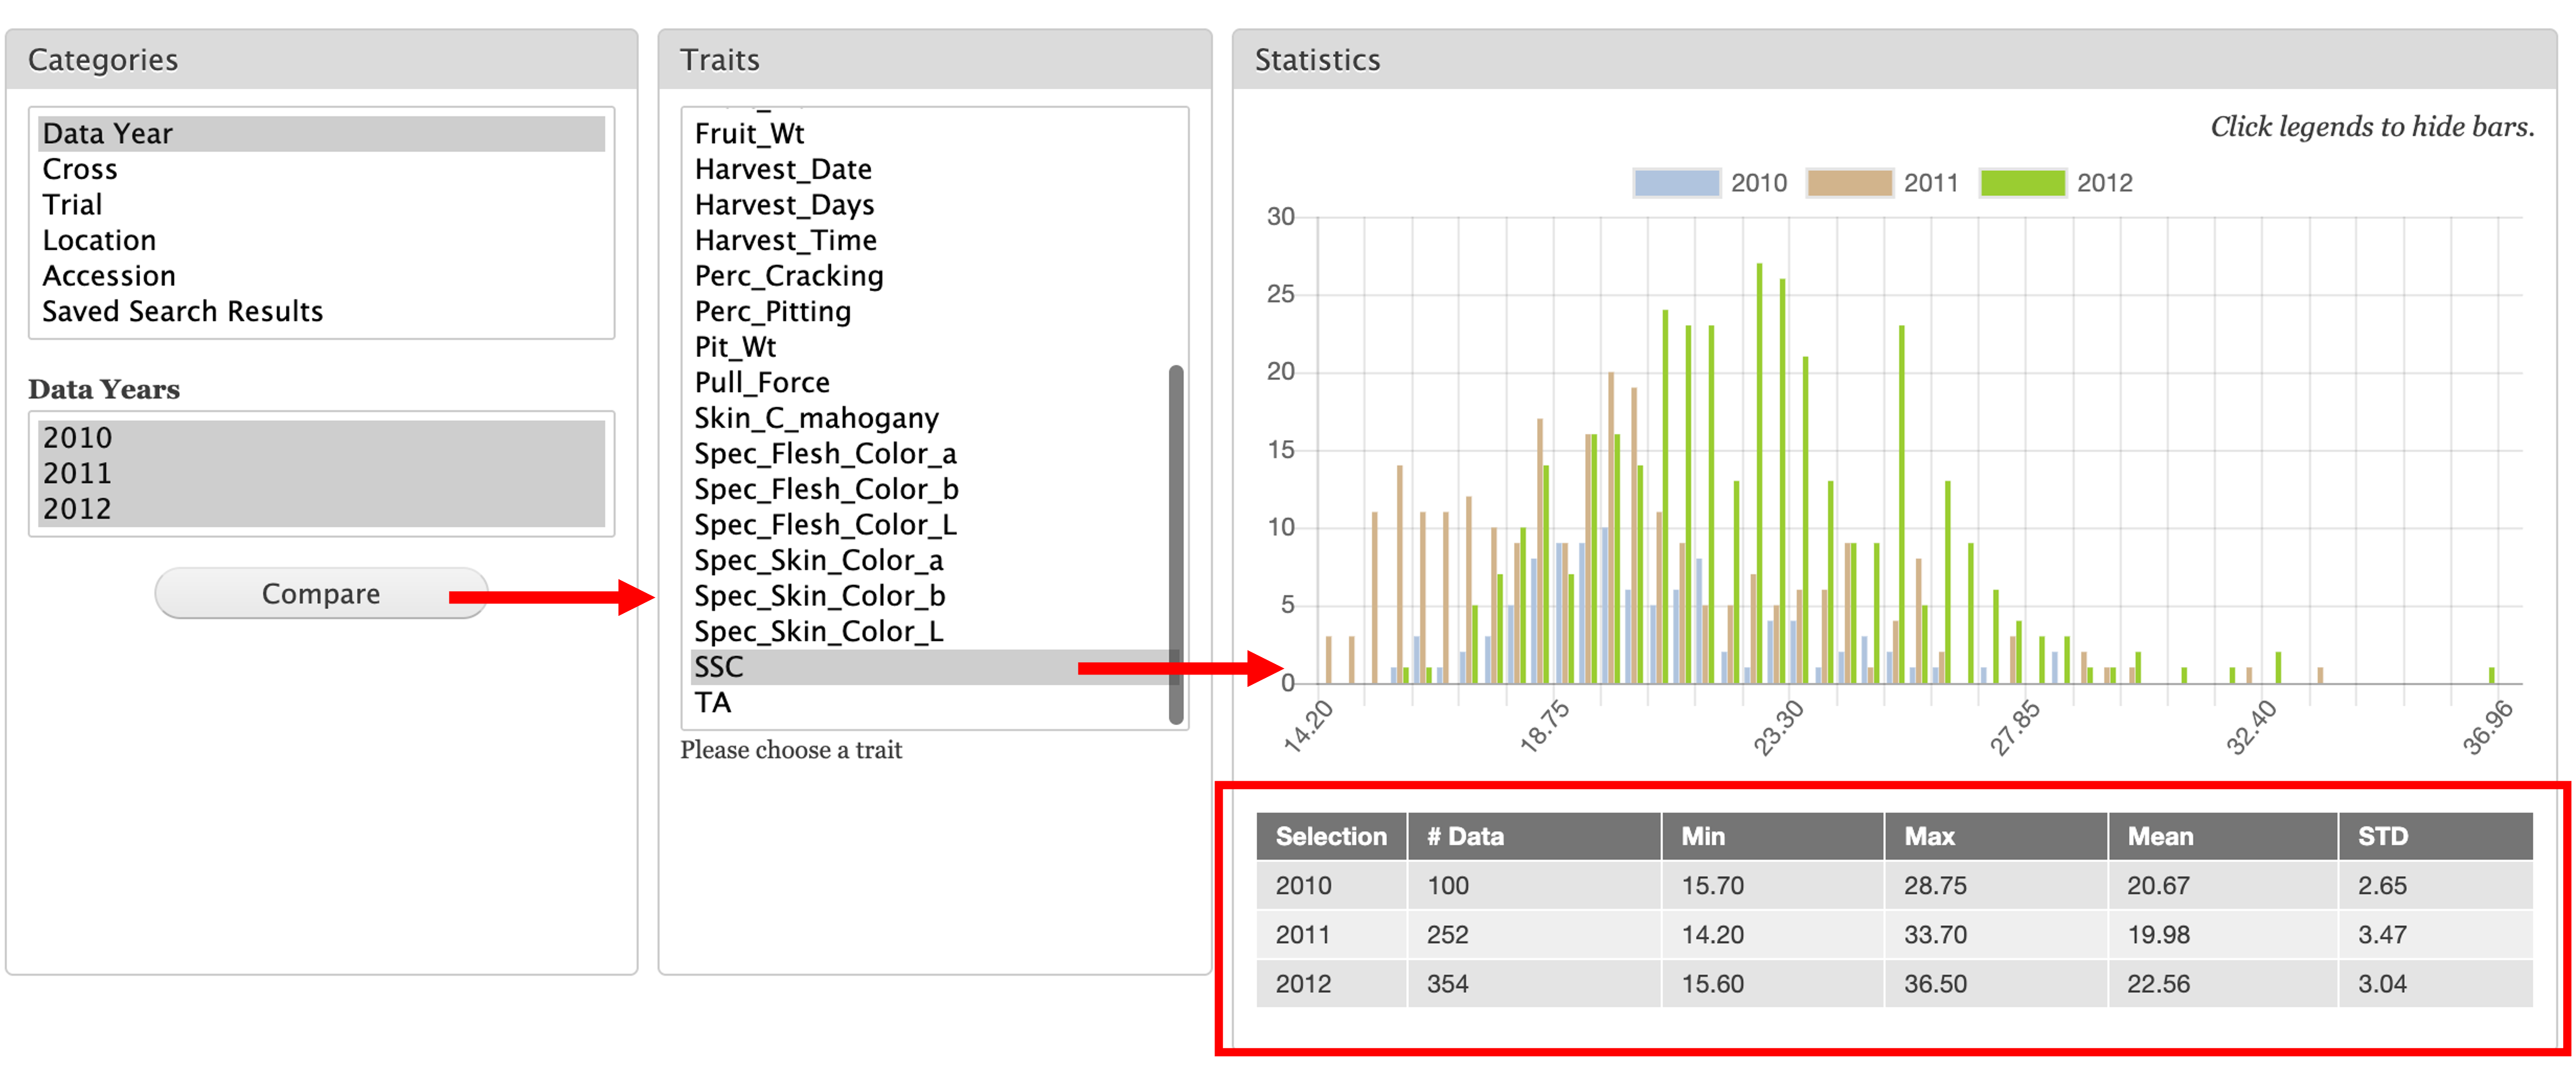
Next, to the right of the “Categories” box will appear the “Traits” box. Clicking the trait you wish to look at will open the “Statistics” box to the right. You will see a histogram of the available data color coded by the years. Additionally, below the histogram you will see the number of data points, minimum, maximum, mean, and standard deviation for each of the years.
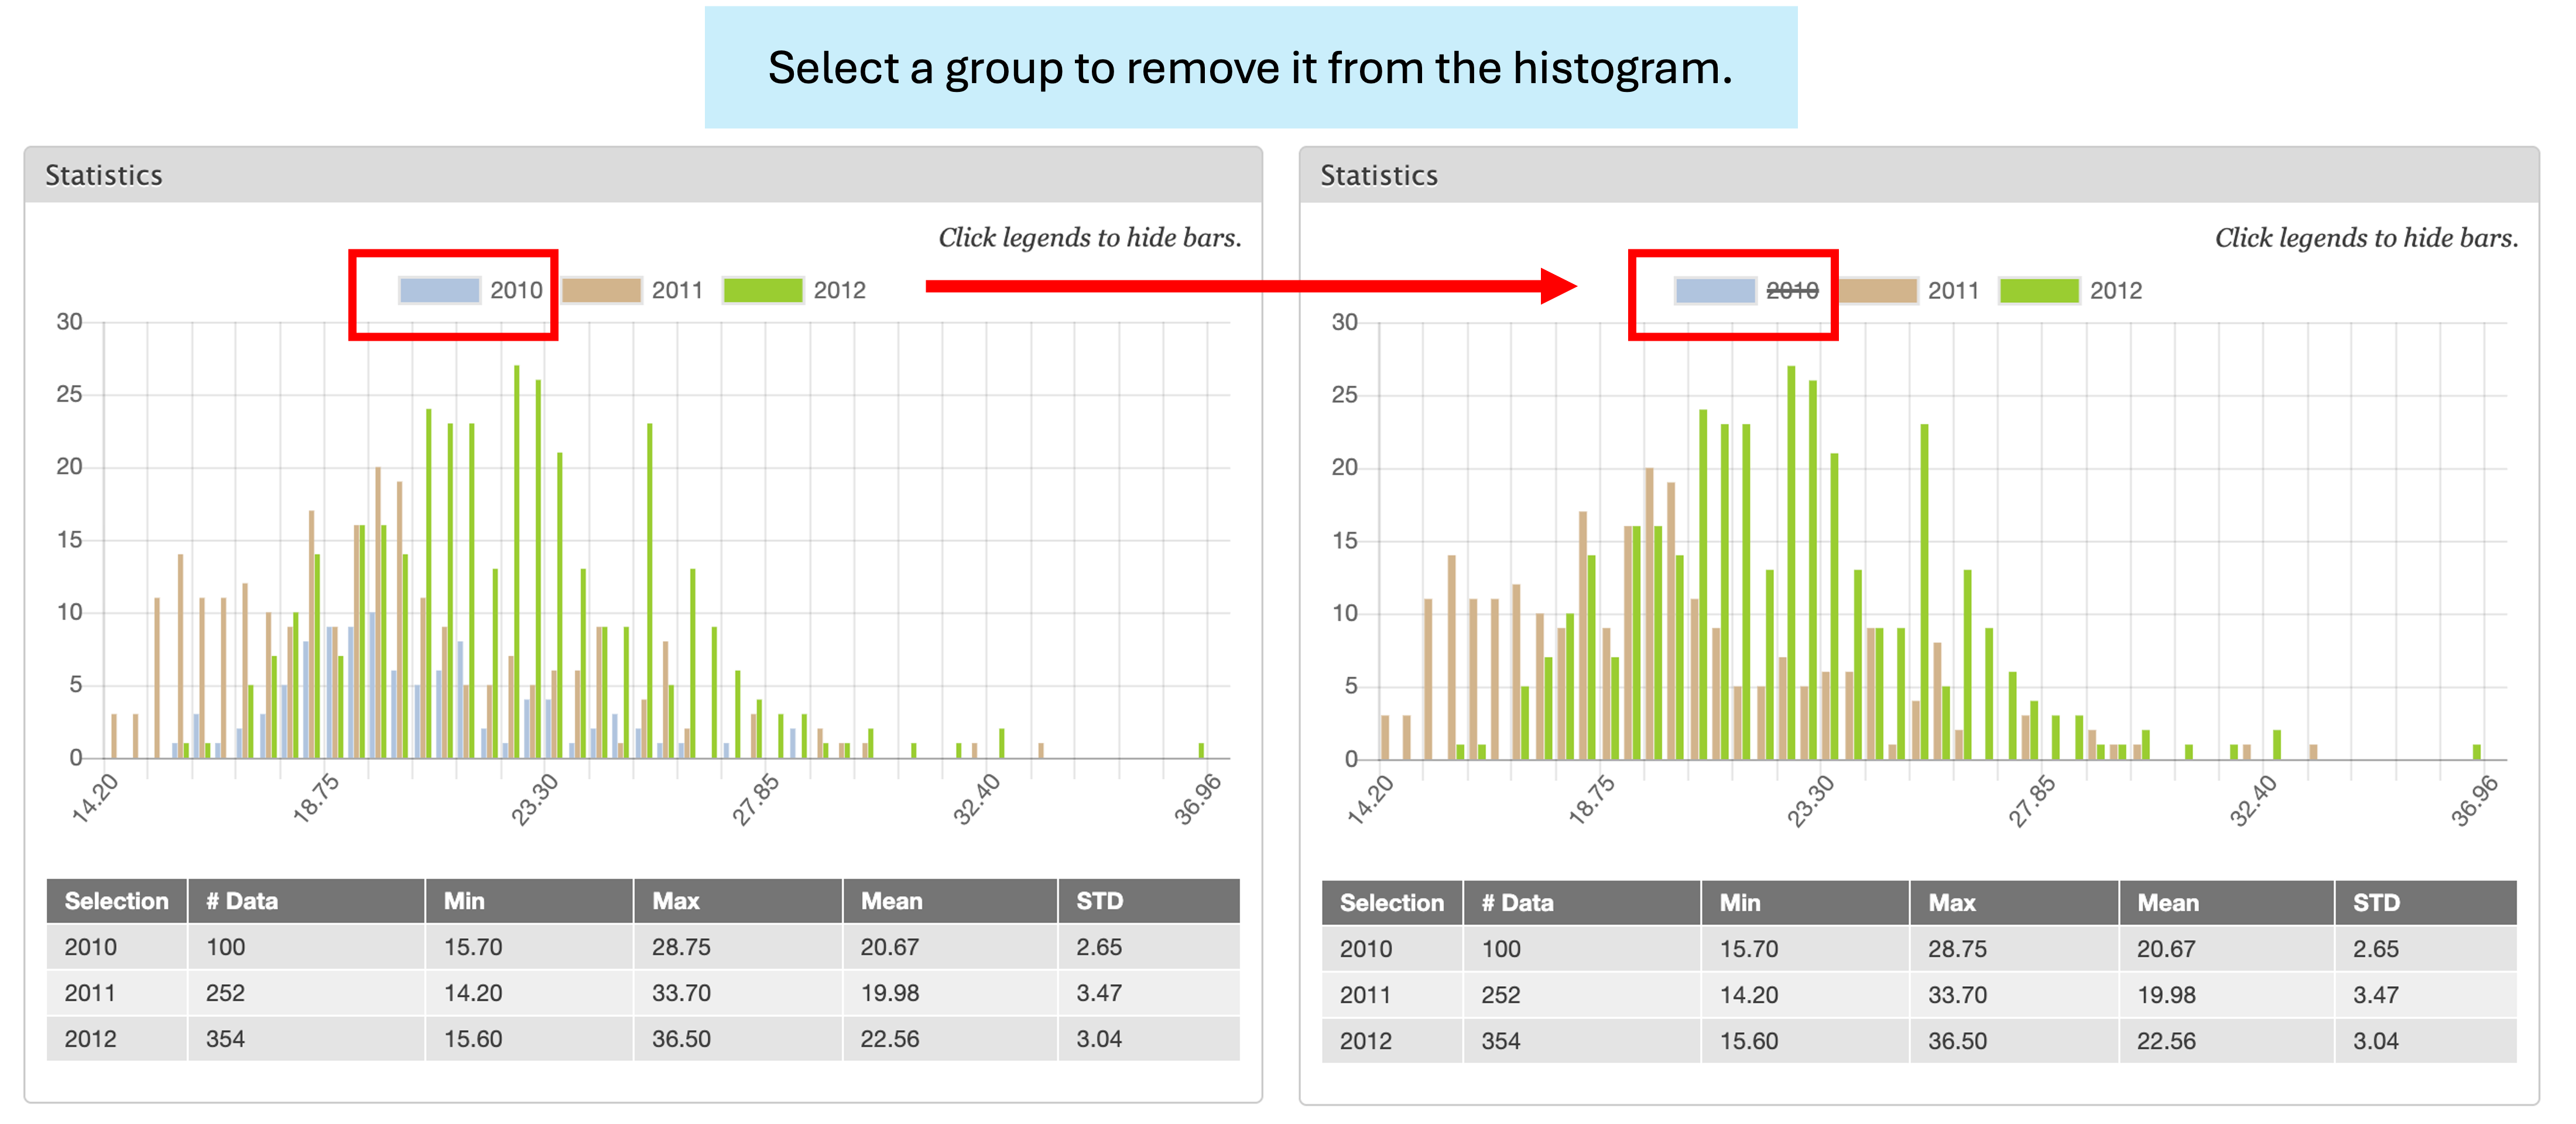
When viewing the histogram, you can click one of the years to make the data for that year disappear from the graph. Re-clicking the year will cause the data to re-appear.
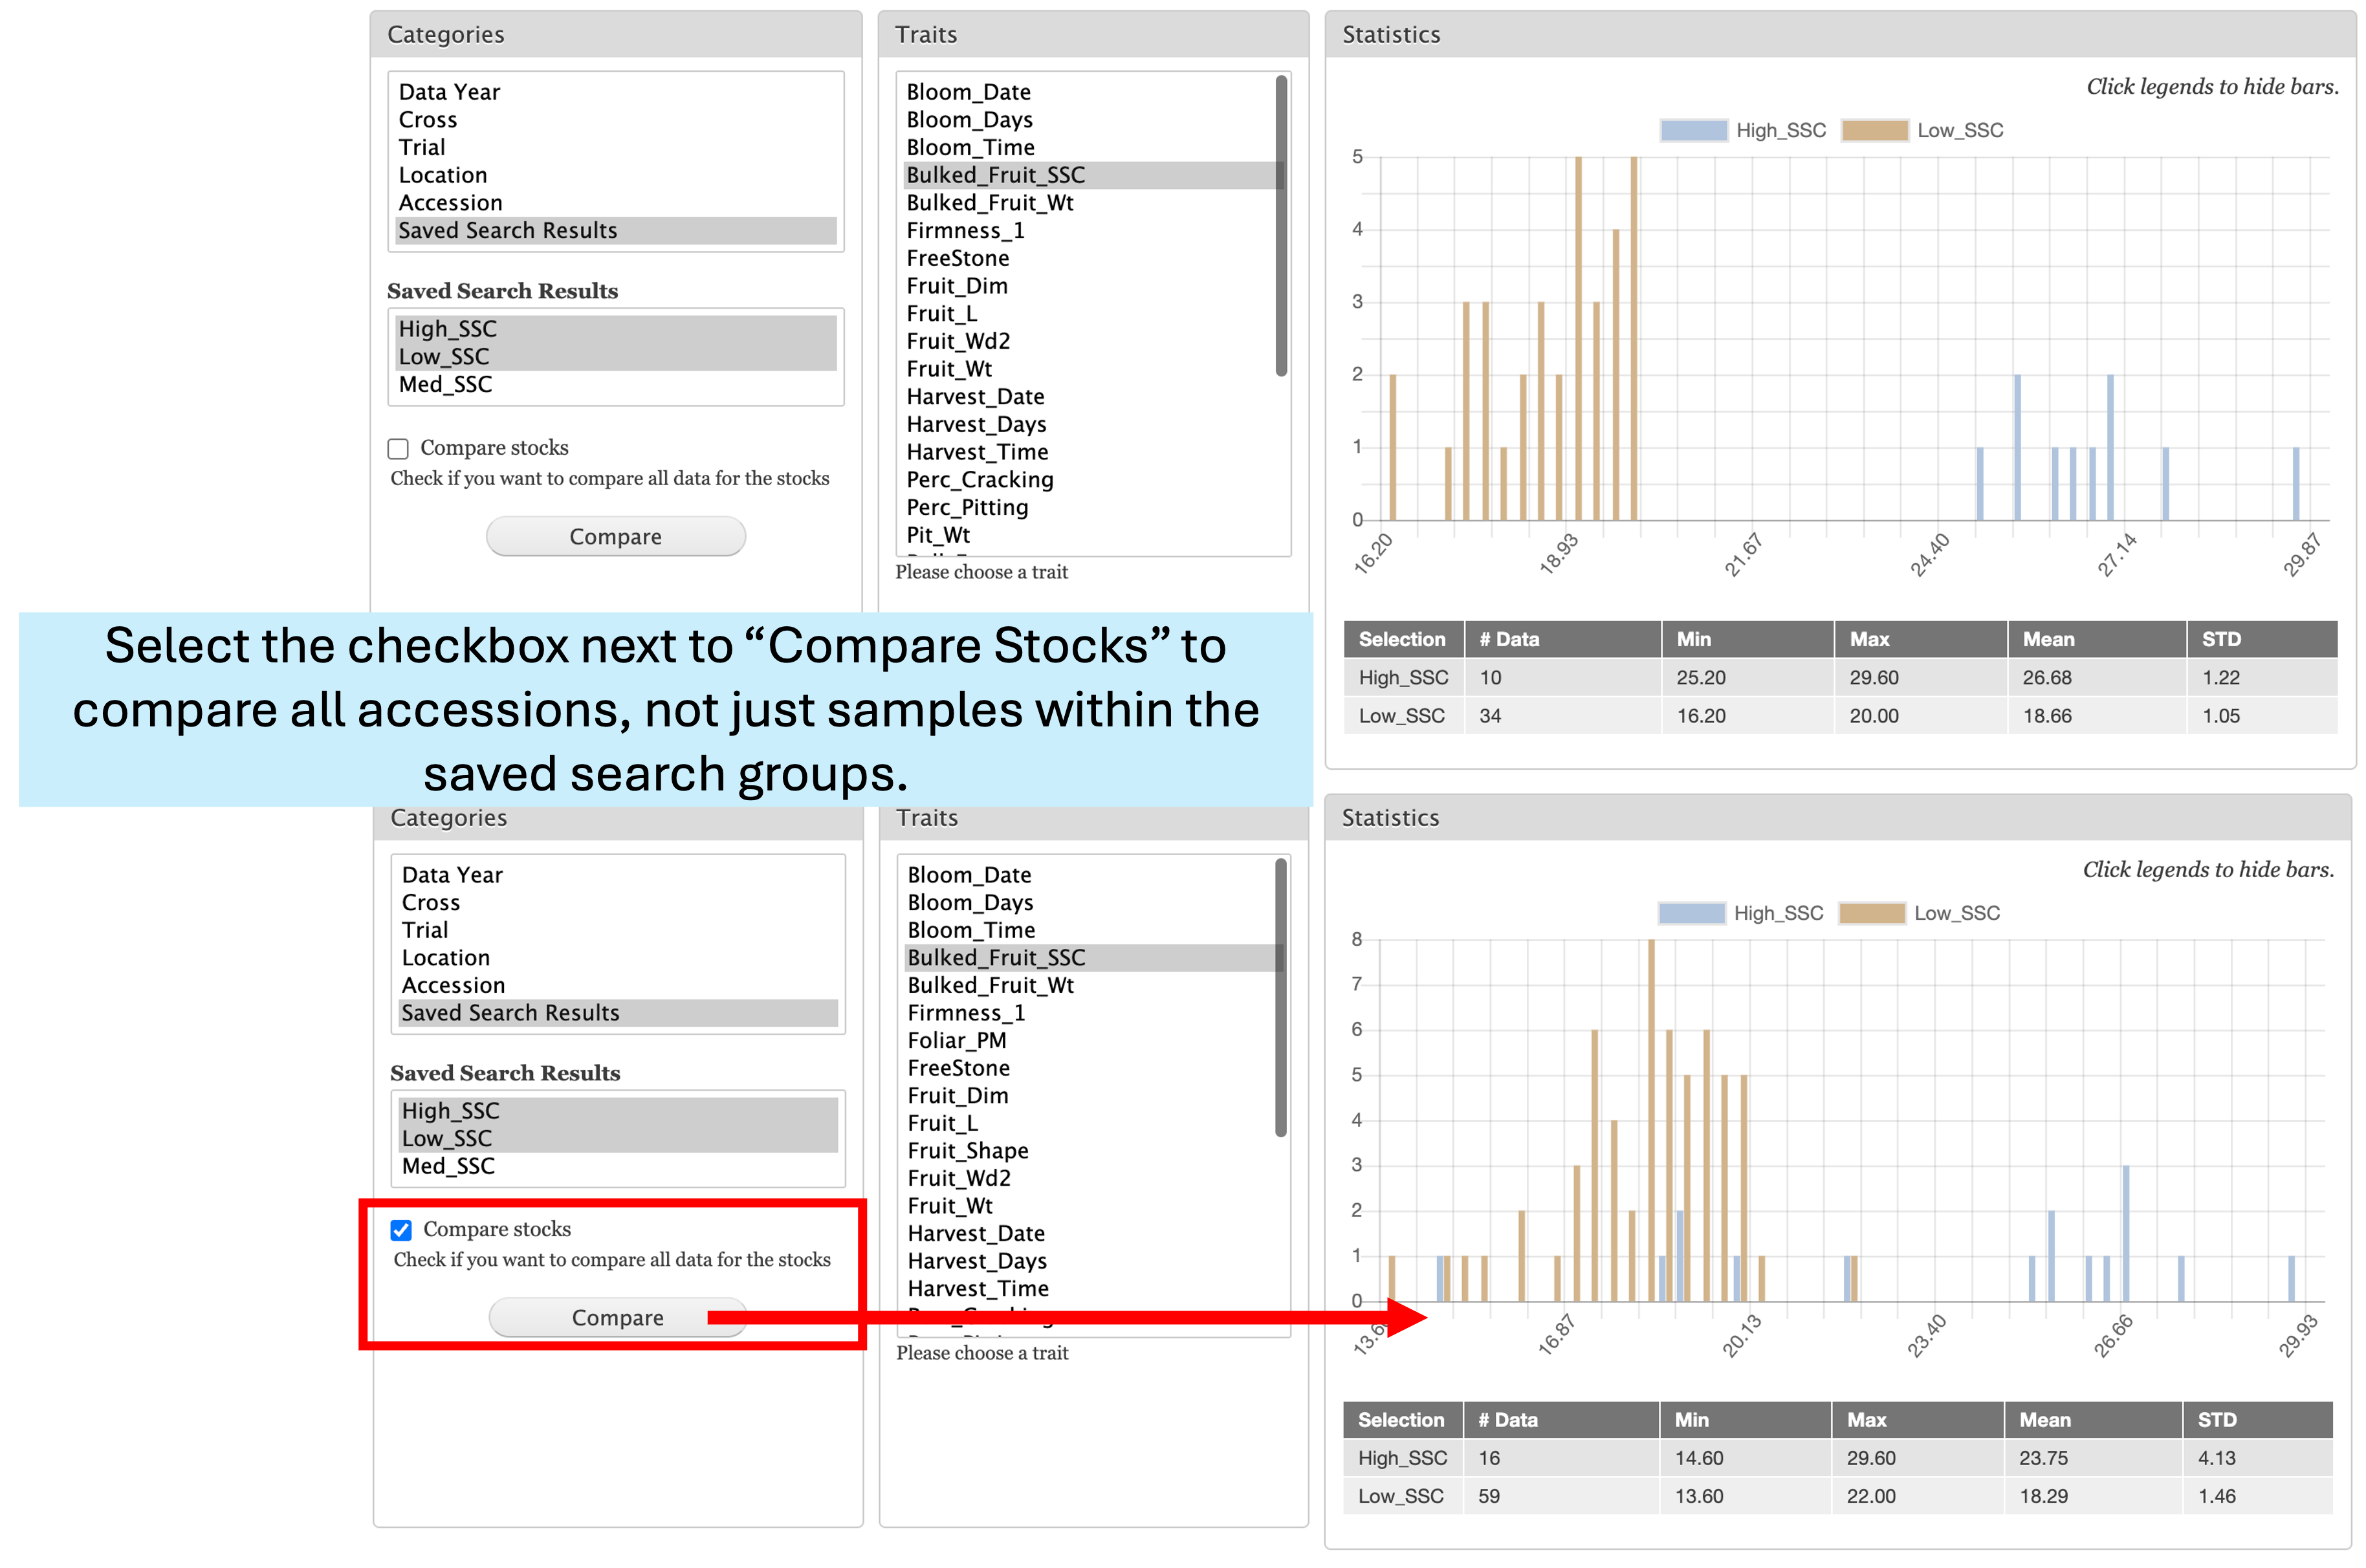
You can also compare traits using your saved search results. To do so, click “Saved Search Results” from the “Categories” box. Below the box, you will see the “Saved Search Results” pop up with a list of the names of your previously saved searches. Select multiple lists to compare. The default will only include the samples within your saved search. However, below the “Saved Search Results” box is a check box next to “Compare stocks”. Selecting this box will compare trait values from all samples from the accessions, or stock, within that saved search, not only the specific samples filtered by that search.
How to use the pedigree viewer tool
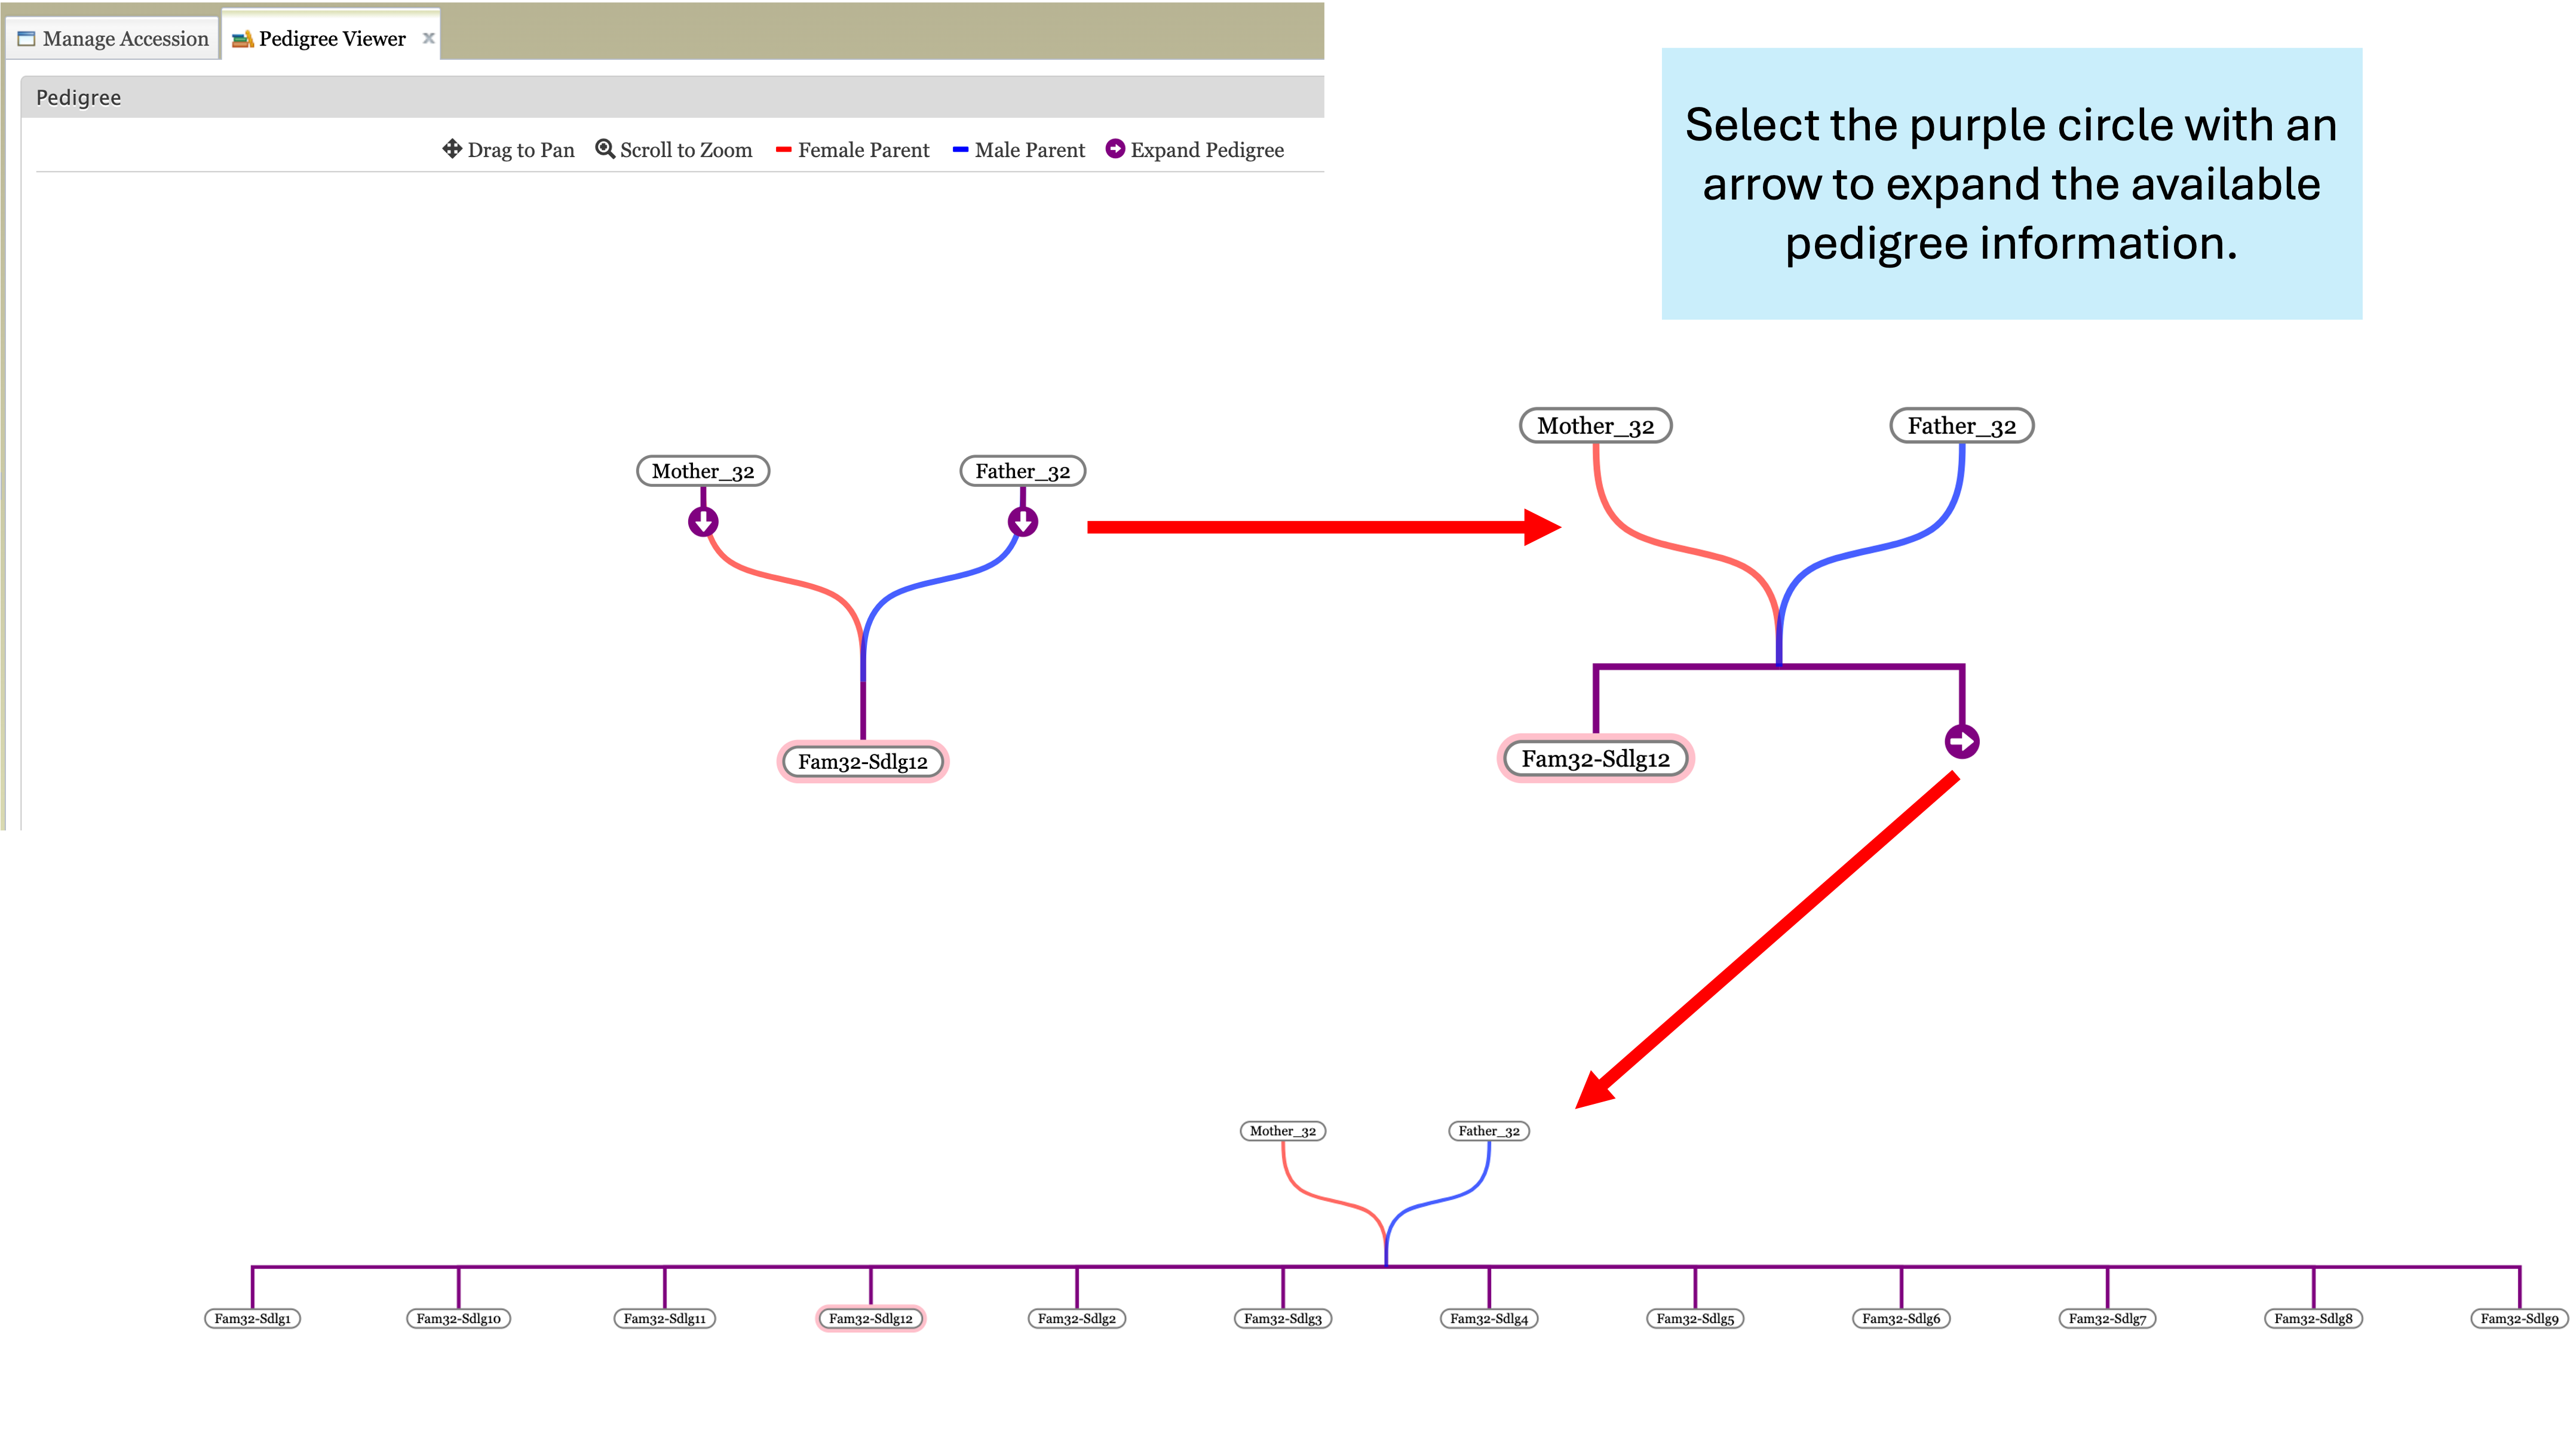
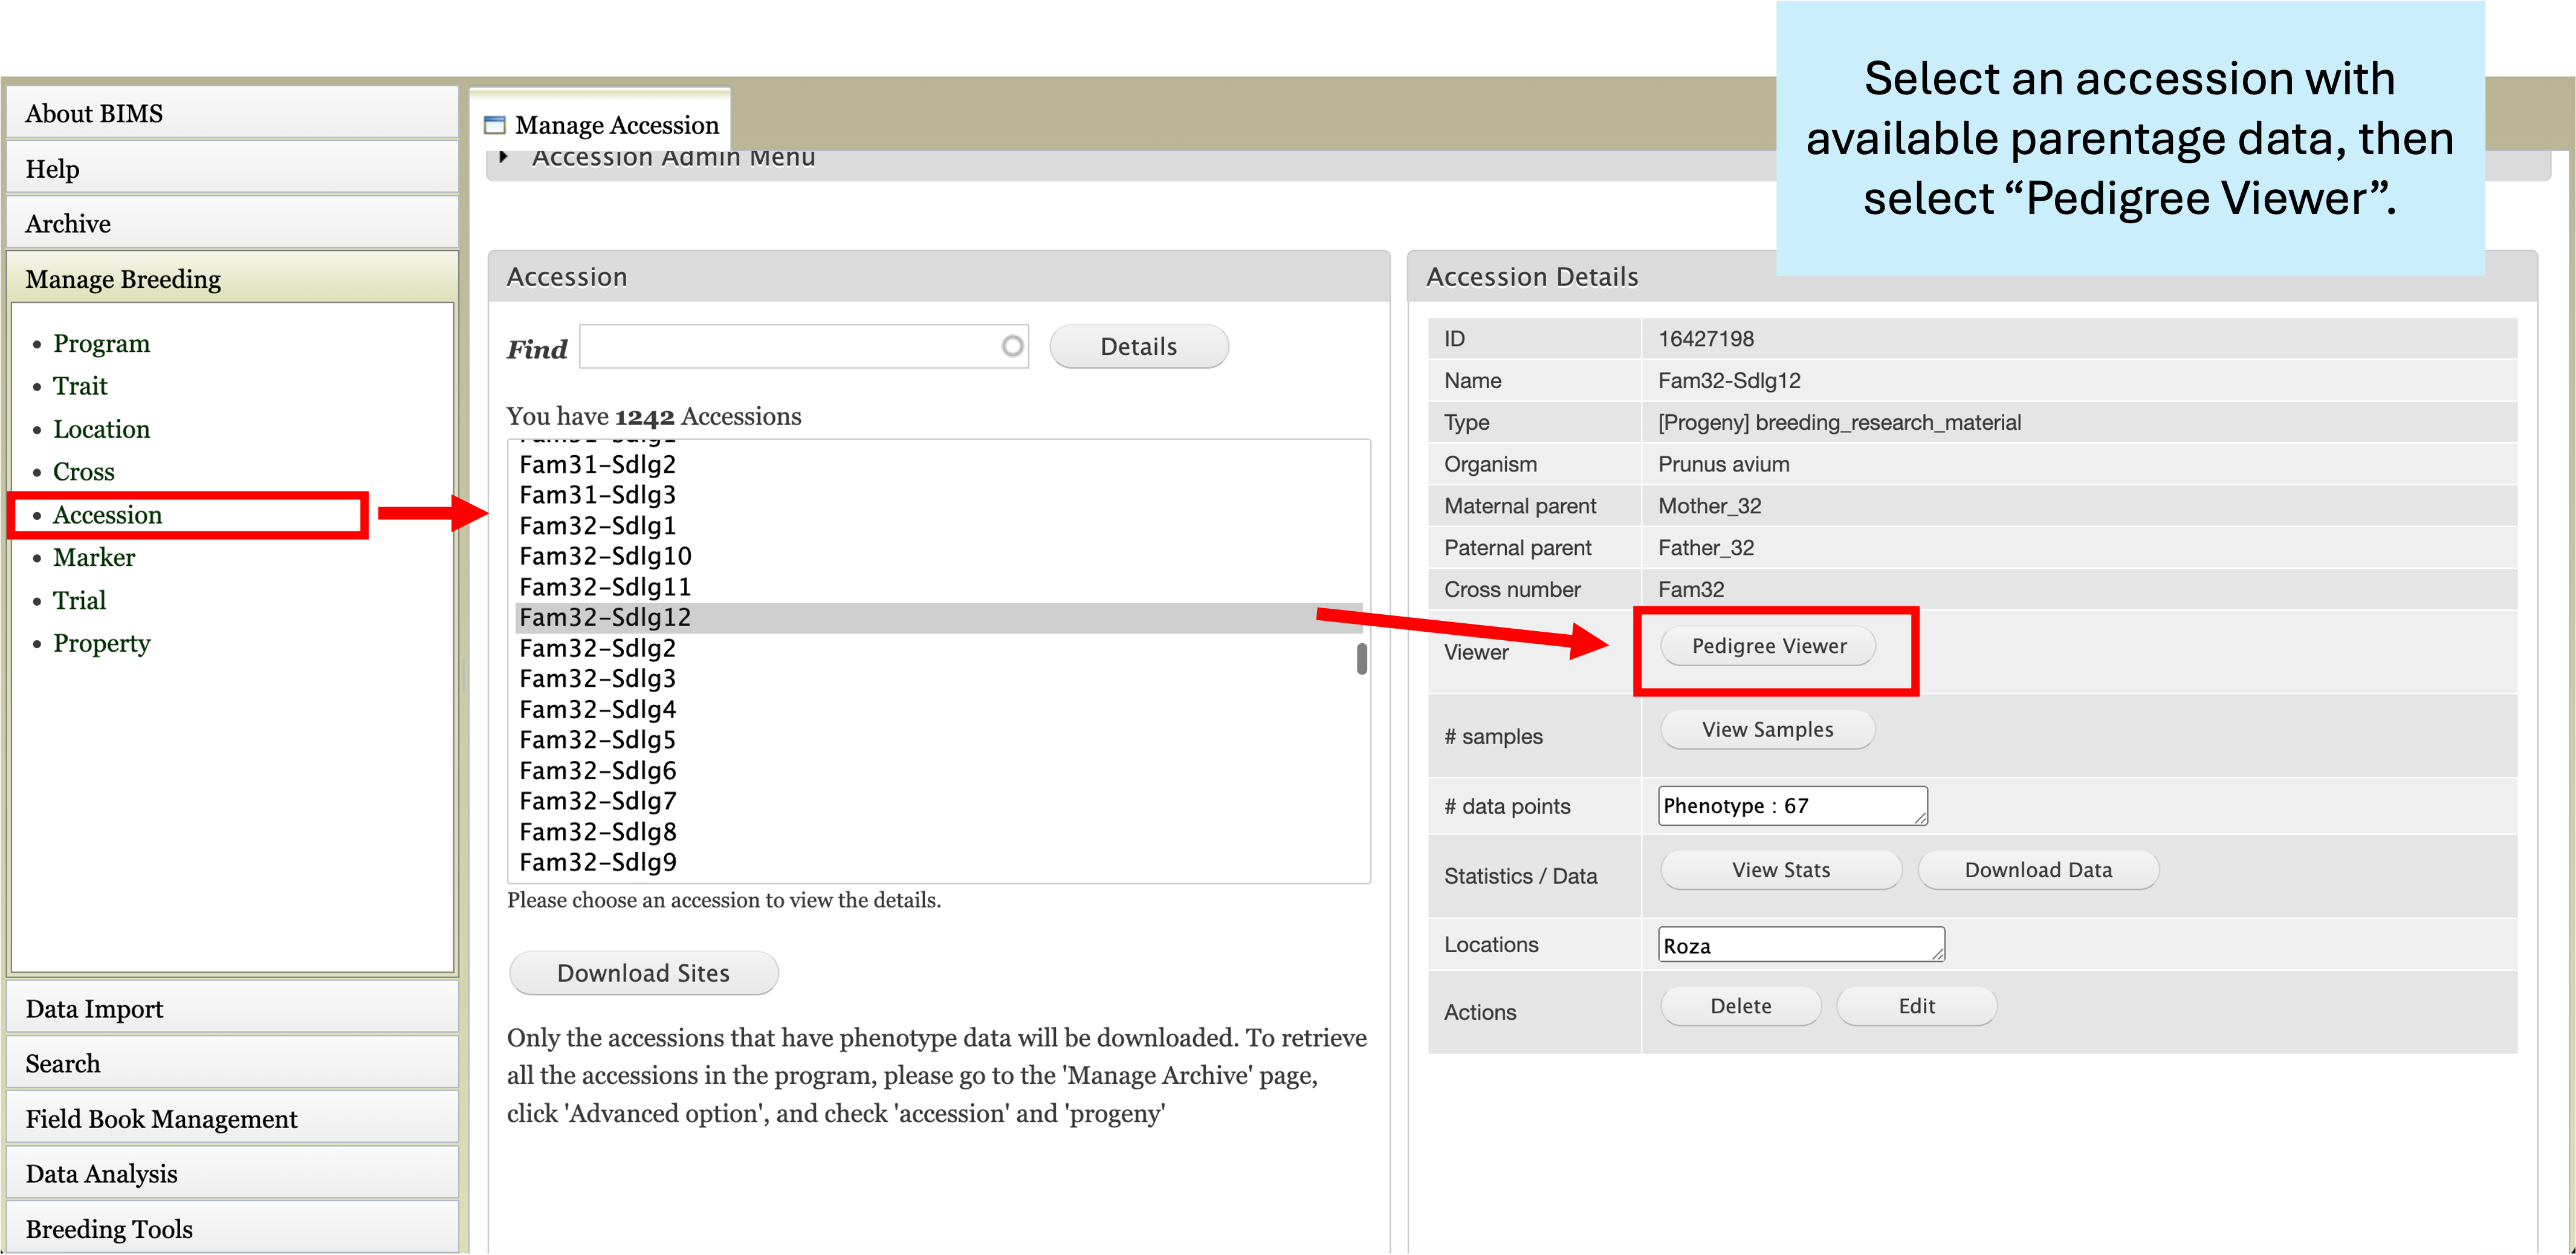
The pedigree viewer tool can be used to generate and view a pedigree for accessions within your program with parentage data. To view, first navigate to the “Accession” section under “Manage Breeding”. Select any accession with associated pedigree data. The accession details will auto-populate on the right side of the page, including a “Pedigree Viewer” button. Select the button to navigate to the pedigree for the selected accession.
Female and male parents will be connected via red and blue lines, respectively. Additionally, if other connected data is available, you will see a purple circle with an arrow in the middle, which can be used to expand other associated pedigree data. Data can be expanded from parents and offspring when data is available.